
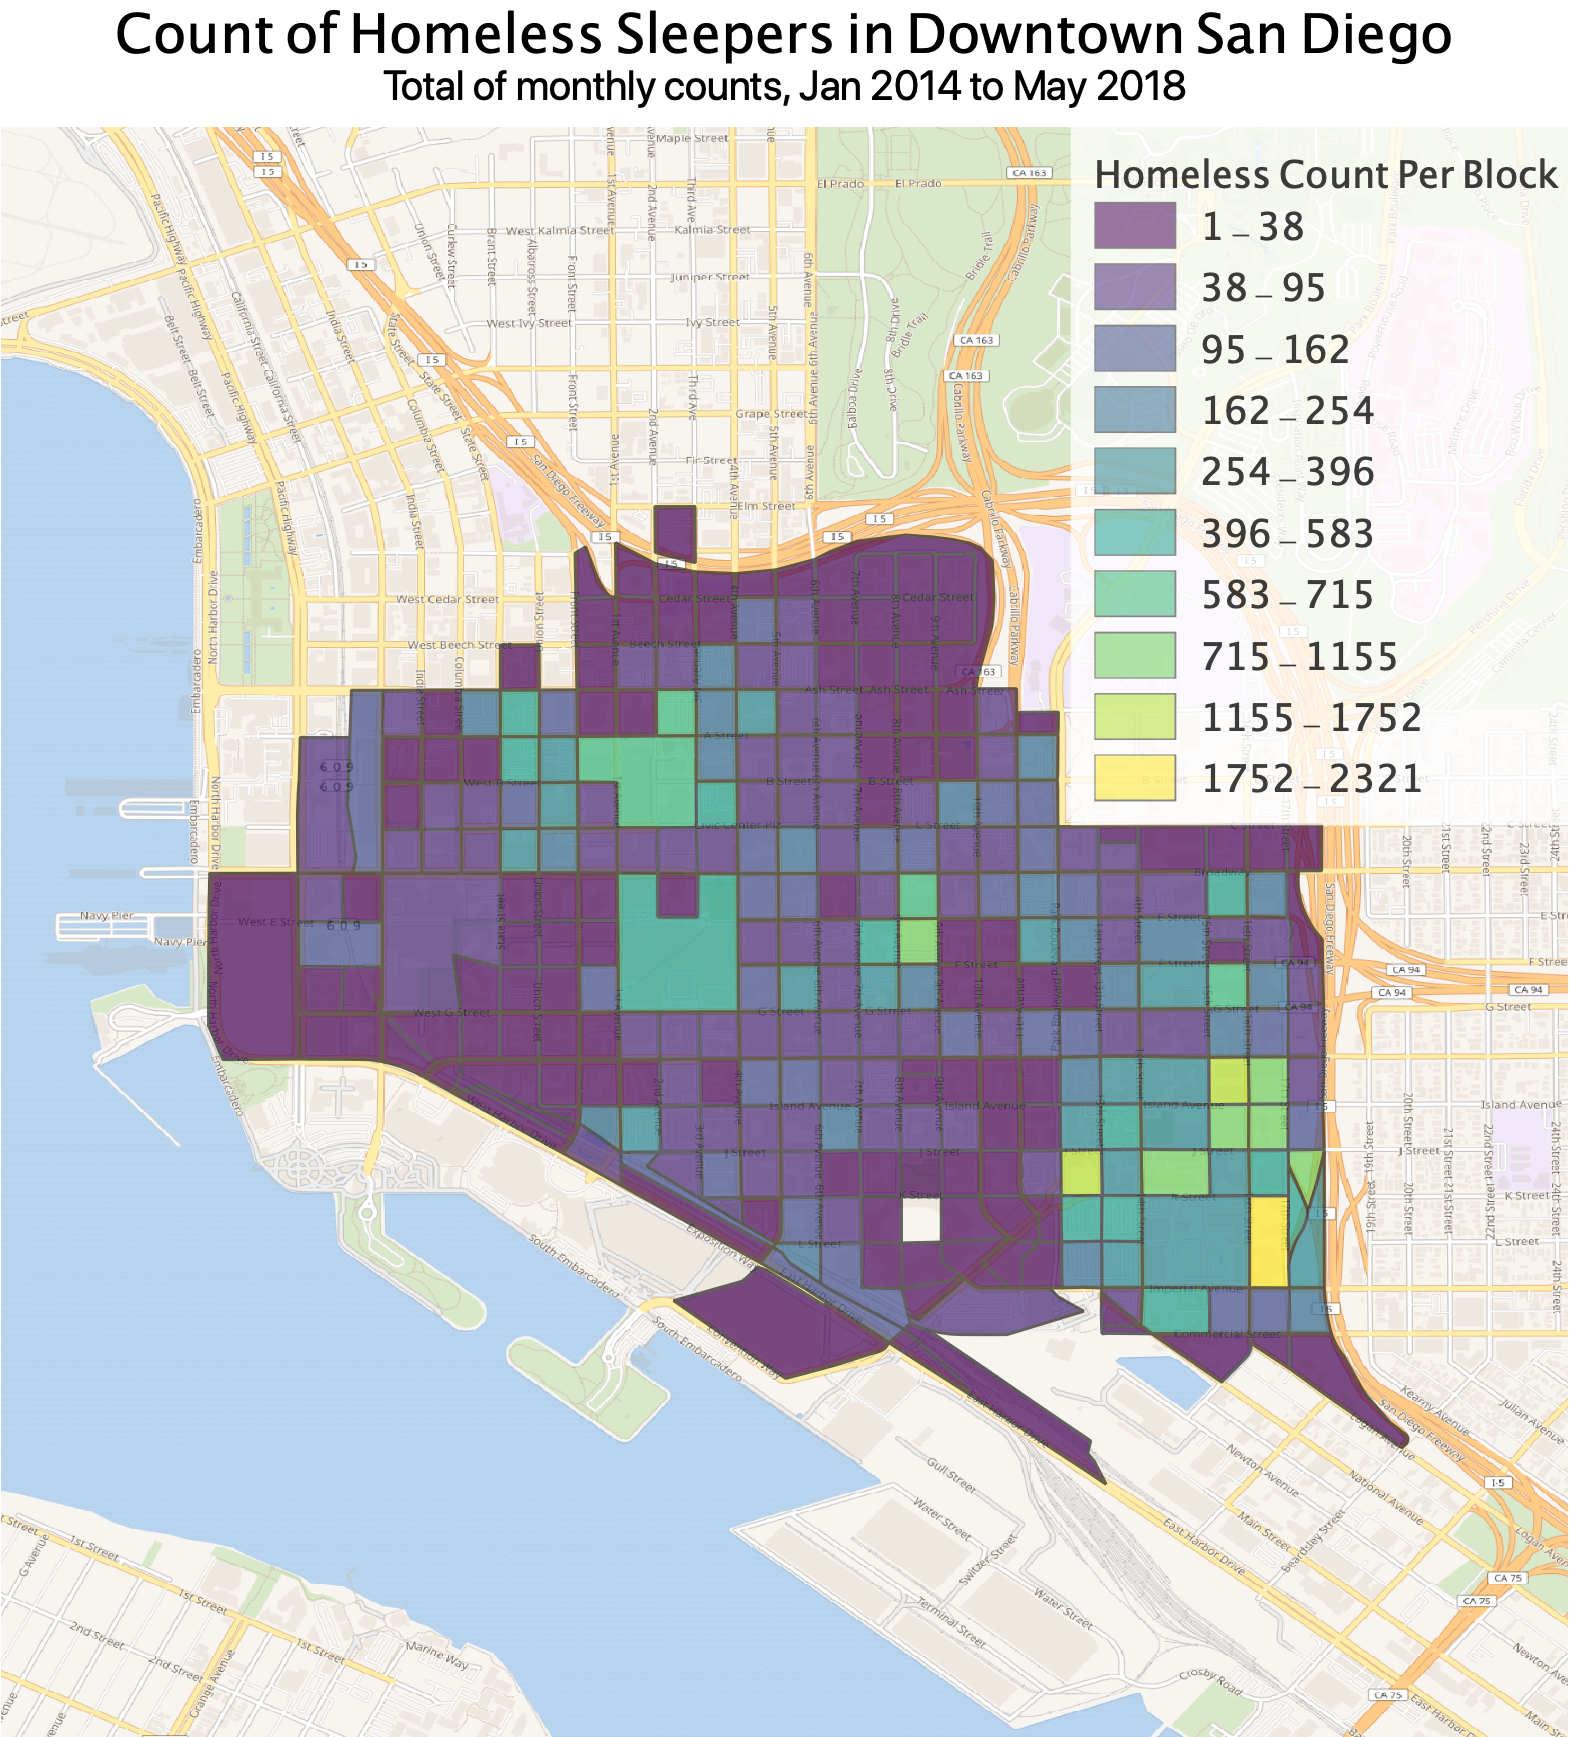
Five years of monthly geographic positions for homeless sleepers in Downtown San Diego
sandiegodata.org-dowtown_homeless-2.1.1. Modified 2022-04-20T20:32:39
Resources | Packages | Documentation| Contacts| References| Data Dictionary
Resources
- neighborhood_totals. Totals for each of the neighborhoods for 2018 and 2019, from the published Downtown San Diego Partnership statistics
- monthly_totals. Monthly totals since 2012, from the published Downtown San Diego Partnership statistics
- homeless_counts. Counts of homeless sleepers in Downtown San Diego, 2014 to mid 2018.
- imputed_counts. The homeless_counts file with missing months probablistically imputed
- downtown_blocks. Census TIGER geographic regions for the blocks that have one or more homeless sleepers in this dataset.
Documentation
This dataset provides geographic locations for homeless sleepers in Downtown San Diego, as counted by enumerators from the Downtown San Diego Partnership. These counts have been done monthly since 2012, and this dataset provides counts since 2014.
The count is done on paper maps with handwritten count marks. The San Diego Regional Data Library’s Downton Homelessness project converted these scanned count maps using a web based image annotation tool.
Base and Imputed Datasets
This distribution has two version of the homeless counts, the base set,
homeless_counts, which has three months of missing data, and the imputed
dataset, imputed_counts in which these three missing months, 2014-08,
2014-09, and 2015-06 are probabilistically re-created.
The Imputation process uses the total count for the month, from the
monthly_totals dataset, as the number of sleepers that the imputed month
will have. Then, the imputation process collects at least 1,000 records with
dates near the missing month into a sample set, calculating the portion of
records that are in each census block. Then the algorithm randomly selects that
number of records for each census block, and adjusts random blocks so the total
of the whole set of selected records is equal to the official count for the
month.
The result is an imputed month that has the same number of records as the official count for the month and as the same portion of sleepers in each census block as in adjacent months.
Notes
Notes for the source dataset, as of April 2019:
The preliminary methodology (shown in yellow) [ March 2017 and earlier] counted two individuals per tent and two individuals per vehicle.
On April 27, 2017, the Clean & Safe program adopted the counting methodology used by the Regional Task Force on the Homeless. Per the methodology (represented above by the dark green cells), [April 2017 to April 2018, inclusive ] Clean & Safe staff counted 1.75 individuals per visible tent/structure and 1.66 individuals per vehicle that showed clear signs of habitation.
In May 2018, the Regional Task Force on the Homeless updated the methodology for vehicles to 2.03 that shows clear signs of habitation (the methodology of 1.75 individuals per tent/structure remained the same). The Clean & Safe program implemented this methodology on May 31, 2018 (represented in orange).
* Denotes the months that The Downtown Fellowship of Ministries and Churches collaborated with us on the monthly homeless sleep count.
**East Village breakout areas include the following: * North East East Village is the area north of Market Street & east of Park Ave. * North West is the area north of Market Street & west of Park Ave. * South East is the area east of Park Ave. south of Market Street * South West is the area west of Park Ave. south of Market Street
Caveats
Because this data is extracted, manually, from manually recorded maps, there are a lot of quality issues.
Missing Months
Because of conversion errors and some complications with the source maps, there are several months of data that are excluded from this dataset
- August 2014. In the original datasets, August 2014 was a duplicate of September 2014.
- September 2014. Comfusion related to the duplication of September and August resulted in September being incompletely processed.
- June 2015. All of the map images for this month were blank. An alternate source PDF exists that is not blank, but this file was not used.
- March 2018 on. The converted data includes months up to July 2018, but the data for April, May, June and July 2018 shows very low values for the East Village neghborhood, so these months are excluded.
These months are re-created, probabilistically, in the
imputed_countsdataset.
Not Using Ocupancy Multipliers
Since about 2017, HUD has instructed point-in-time homeless counts to multiply the counts of sleepers in structures and vehicles by factors to account for people who may be obsured and not directly countable. From April 2017 on, Downtown San Diego Partnership has been using these factors.
However, this dataset does not use the occupancy factors, to allow analysts to apply these factors consistently across all months of data. As a result, the counts from this dataset diverge from the official counts after March 2017.
Other Issues
- The
total_countoften does not match the sum of counts on the map. These sums were made by hand, by the enumerator who made the counts, so there are occasional arithmetic errors. - There are many instances of missing values for
rainortemp - Some dates include the day of the month, but many don’t These dates have a day of month of 1.
- Date day of month is generally unreliable. Only the year and month are reliable, except for files noted above.
- The
neighborhoodvalue is based on the map names, so in some months the East Village neighborhood is separated intoeast_villageandeast_village_south
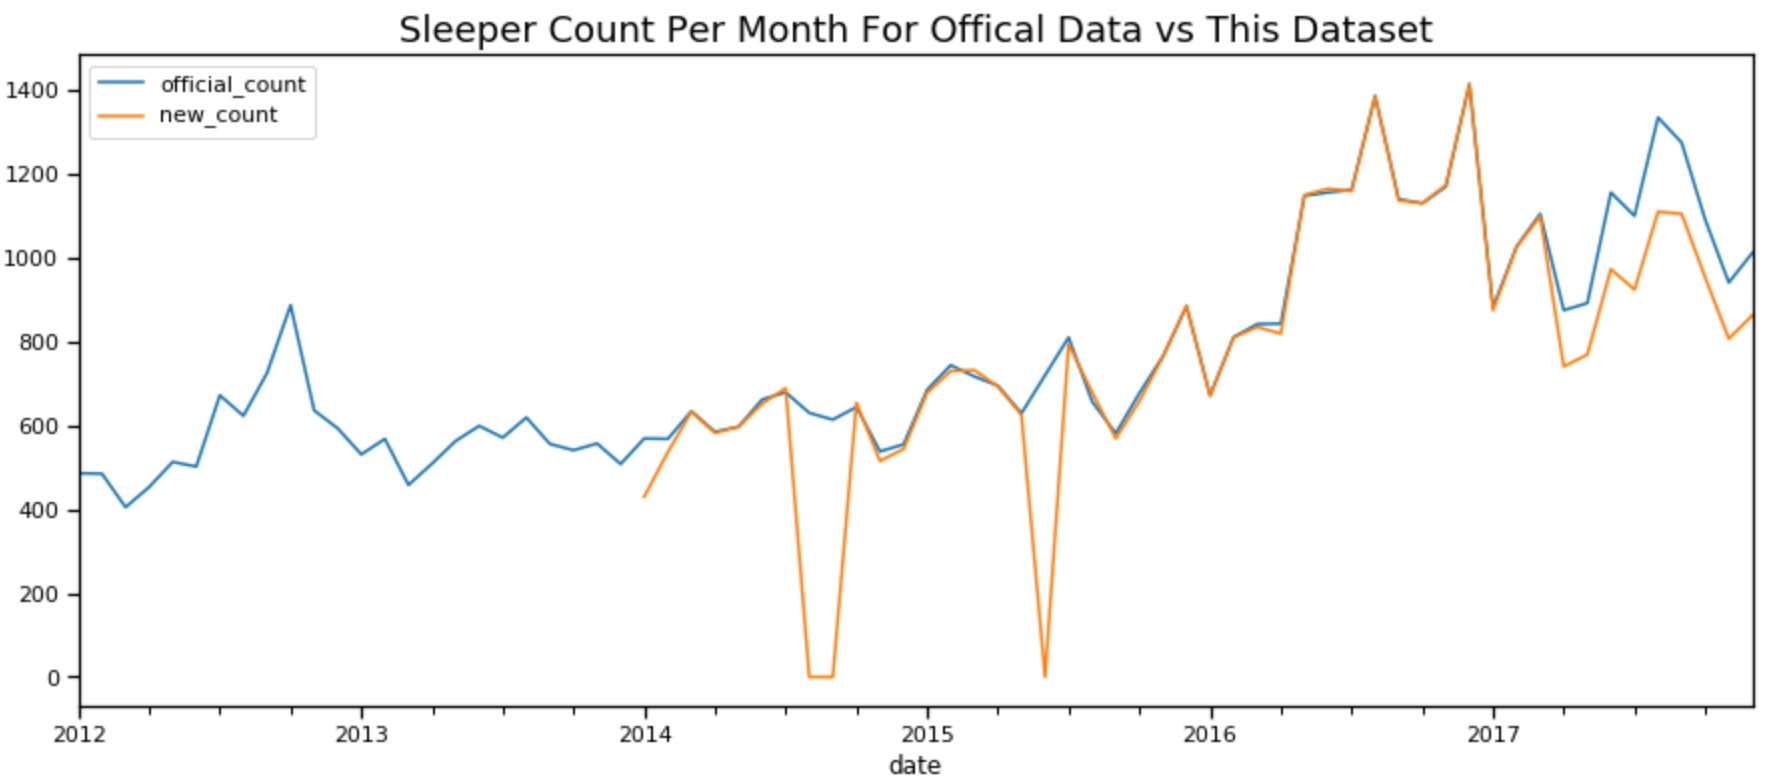
Comparison to Official Published Counts
This plot shows, per month, the offical published counts from San Diego Downtown Partnership versus the total from this dataset. Note the descrepancies dues to issues noted above, including missing months, minor differences in some months, and the divergence after March 2017 due to occupancy multiplers.
Versions
- Initial Version
- Reload upstream source, with better datatypes
- Add monthly and neighborhood totals
- Updated to version 4 source package
- Updates to version 5 of source package, which excluded several months with quality problems, improved documentation
- Added column for source file, removed duplicated data form marina, 2016
- Added imputed counts dataset.
- Updated the
monthly_totalsdataset - Added downtown_blocks geography and removed April 2018 on.
- Corrected geometry from POLYGON ( of the city block ) to the POINT of the observation
Documentation Links
Contacts
- Wrangler
Data Dictionary
homeless_counts | imputed_counts | neighborhood_totals | monthly_totals | downtown_blockshomeless_counts
| Column Name | Data Type | Description |
|---|---|---|
| neighborhood | string | Neighborhood, from the label on the source map |
| date | date | Date of the observation. Many dates have no know day of month; for these dates, the day of month is set to 1 |
| type | string | Type of sleeper: individual, vehicle or structure |
| temp | float | Temperature, if it was written on the source map |
| rain | string | Rain or clear, if it was written on the source map |
| geoid | string | Census geoid for the 2010 Census block the observation is in, in ACS format |
| x | number | X geographic position, in California State Plane 6, EPSG:2230 |
| y | number | Y geographic position, in California State Plane 6, EPSG:2230 |
| geometry | string | Geographic position of observation, in Lat/Lon, EPSG:4326 |
imputed_counts
| Column Name | Data Type | Description |
|---|---|---|
| neighborhood | string | Neighborhood, from the label on the source map |
| date | datetime | Date of the observation. Many dates have no know day of month; for these dates, the day of month is set to 1 |
| type | string | Type of sleeper: individual, vehicle or structure |
| temp | integer | Temperature, if it was written on the source map |
| rain | string | Rain or clear, if it was written on the source map |
| geoid | string | Census geoid for the 2010 Census block the observation is in, in ACS format |
| x | number | X geographic position, in California State Plane 6, EPSG:2230 |
| y | number | Y geographic position, in California State Plane 6, EPSG:2230 |
| geometry | string | Geographic position of observation, in Lat/Lon, EPSG:4326 |
neighborhood_totals
| Column Name | Data Type | Description |
|---|---|---|
| date | date | Date of count. Only the month and year are significant. |
| east_village | integer | Neighborhood count |
| city_center | integer | Neighborhood count |
| columbia | integer | Neighborhood count |
| marina | integer | Neighborhood count |
| cortez | integer | Neighborhood count |
| gaslamp | integer | Neighborhood count |
monthly_totals
| Column Name | Data Type | Description |
|---|---|---|
| date | date | Date of total. Only the year and month are significant |
| count | integer | Total count |
downtown_blocks
| Column Name | Data Type | Description |
|---|---|---|
| statefp10 | string | |
| countyfp10 | string | |
| tractce10 | string | |
| blockce10 | string | |
| geoid10 | string | |
| name10 | string | |
| mtfcc10 | string | |
| ur10 | string | |
| uace10 | string | |
| funcstat10 | string | |
| aland10 | integer | |
| awater10 | integer | |
| intptlat10 | number | |
| intptlon10 | number | |
| geometry | string |
References
Urls used in the creation of this data package.
- metapack+http://library.metatab.org/sandiegodata.org-downtown_homeless-source-6.csv#counts. Final homeless sleeper counts
- metapack+http://library.metatab.org/sandiegodata.org-downtown_homeless-source-6.csv#files. Final file annotations, including total counts, temperature and weather.
- shape+https://www2.census.gov/geo/pvs/tiger2010st/06_California/06073/tl_2010_06073_tabblock10.zip. 2010 Census blocks for San Diego County
Packages
- zip http://library.metatab.org/sandiegodata.org-dowtown_homeless-2.1.1.zip
- s3 s3://library.metatab.org/sandiegodata.org-dowtown_homeless-2.1.1.csv
- csv http://library.metatab.org/sandiegodata.org-dowtown_homeless-2.1.1.csv
- source https://github.com/sandiegodata-projects/downtown-partnership.git
Accessing Data in Vanilla Pandas
import pandas as pd


neighborhood_totals_df =  pd.read_csv('http://library.metatab.org/sandiegodata.org-dowtown_homeless-2.1.1/data/neighborhood_totals.csv')
monthly_totals_df =  pd.read_csv('http://library.metatab.org/sandiegodata.org-dowtown_homeless-2.1.1/data/monthly_totals.csv')
homeless_counts_df =  pd.read_csv('http://library.metatab.org/sandiegodata.org-dowtown_homeless-2.1.1/data/homeless_counts.csv')
imputed_counts_df =  pd.read_csv('http://library.metatab.org/sandiegodata.org-dowtown_homeless-2.1.1/data/imputed_counts.csv')
downtown_blocks_df =  pd.read_csv('http://library.metatab.org/sandiegodata.org-dowtown_homeless-2.1.1/data/downtown_blocks.csv')
Accessing Package in Metapack
import metapack as mp
pkg = mp.open_package('http://library.metatab.org/sandiegodata.org-dowtown_homeless-2.1.1.zip')

# Create Dataframes
neighborhood_totals_df = pkg.resource('neighborhood_totals').dataframe()
monthly_totals_df = pkg.resource('monthly_totals').dataframe()
homeless_counts_gdf = pkg.resource('homeless_counts').geoframe()
imputed_counts_gdf = pkg.resource('imputed_counts').geoframe()
downtown_blocks_gdf = pkg.resource('downtown_blocks').geoframe()
1 thought on “Downtown San Diego Homeless Sleepers”
Comments are closed.